
 English
 русский
 Español
 عربى
عربى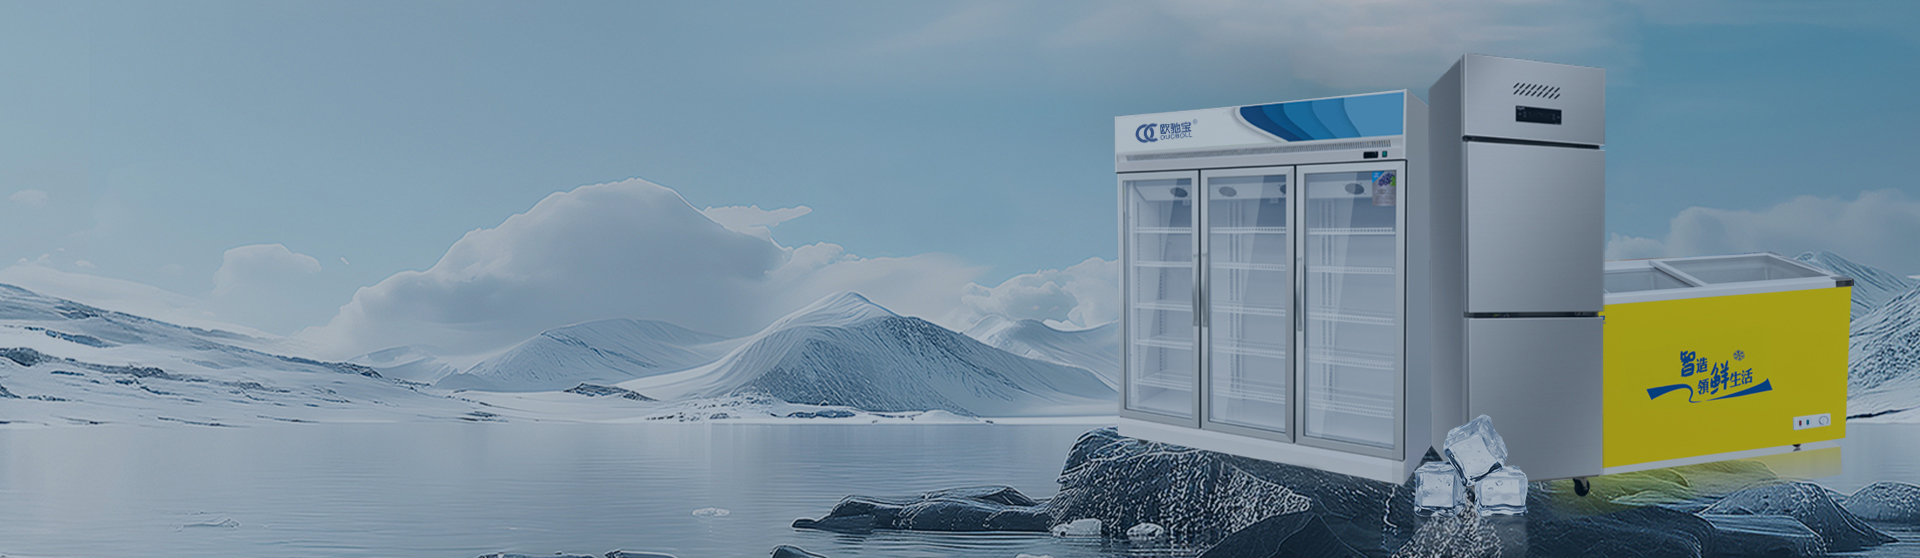
Convenience Store Solutions: Equipment, Tech & Cost Optimization Guide
Content
- 1 1. Why Smart Investments in C-Store Operations Decide Your Margins
- 2 2. Core Solution Categories: A Framework for Decision-Making
- 3 3. Refrigeration Equipment: The Backbone of C-Store Operations
- 4 4. Technology Stack: POS, Digital Signage & Inventory Management
- 5 5. Cash Management & Payment Solutions
- 6 6. Budget-Friendly Solutions for Independent C-Stores
- 7 7. Implementation Roadmap: From Assessment to Deployment
- 8 8. Measuring What Matters: The Metrics That Confirm Your Investment Is Working
1. Why Smart Investments in C-Store Operations Decide Your Margins
Convenience store net profit margins slid to just 1.8% in 2024, according to NACS data, down from 2.3% five years earlier. That thinning margin isn't a fluke. Labor costs climbed 12% across the sector while energy prices for commercial refrigeration alone added an estimated $3,400 per store per year. At the same time, customer expectations shifted — shoppers now walk into a c-store expecting the product visibility of a supermarket aisle and the transaction speed of a drive-thru.
This triple squeeze leaves operators with a blunt choice. Cut corners and watch sales erode, or invest strategically in equipment and systems that pay back within 18 months. The operators who survive the current cycle aren't necessarily the ones with the deepest pockets. They're the ones who treat every dollar of CapEx as a lever against a specific, measurable operating cost.
Convenience store solutions today span refrigeration, point-of-sale technology, cash management, and in-store marketing. The mistake most first-time buyers make is evaluating each category in isolation. A $2,000 digital signage screen delivers weak returns if the cold drinks behind it are poorly lit and stocked at inconsistent temperatures. A high-end POS system adds friction if the cash drawer underneath it still requires manual reconciliation twice per shift.
This article lays out what each solution category actually costs, what returns you can expect, and how to sequence purchases for maximum impact. You will find specific data — kWh comparisons, three-year TCO models, decision matrices by store type — because general advice doesn't help when margins sit below two percent.
2. Core Solution Categories: A Framework for Decision-Making
Every c-store investment falls into one of four buckets: refrigeration equipment, technology systems, payment and cash management, and in-store marketing. The table below maps each category to its primary cost driver, its typical payback window, and the store profile that benefits most. Use this as your first filter before drilling into any single product specification.
| Solution Category | Primary CapEx Range (Single Store) | Typical Payback | Best For |
|---|---|---|---|
| Refrigeration Equipment | $3,000 – $25,000 | 12–24 months (energy + spoilage savings) | All store types; highest impact for high-traffic beverage/food retailers |
| Technology Systems (POS, Inventory) | $2,000 – $15,000 | 8–18 months (labor + shrinkage reduction) | Stores with 2+ employees per shift; multi-location operators |
| Cash Management & Payment | $1,500 – $8,000 | 6–12 months (labor + loss prevention) | High-cash-volume stores; late-night or high-risk locations |
| In-Store Marketing (Signage, Media) | $800 – $5,000 | 3–9 months (impulse lift) | Stores with strong foot traffic; new locations building awareness |
Refrigeration deserves to sit at the top of this list for a reason few operators calculate before they see the utility bill. Commercial cooling accounts for roughly 35% to 45% of a typical c-store's total electricity consumption. Replacing one aging open-front display cooler with a modern glass-door unit can cut that line item by 18% to 22% annually. That alone often covers the financing cost of the new equipment.
Technology systems deliver their savings differently — through labor efficiency rather than utility reduction. A cloud-based POS with integrated inventory tracking can shave 4 to 7 hours per week off back-office tasks like stock counting, purchase order creation, and shift reconciliation. For a store paying $16 per hour, that weekly saving translates to roughly $3,300 to $5,800 per year in recovered labor, before accounting for shrinkage reduction.
Cash management solutions offer the fastest payback in the matrix above, but only for stores where cash transactions still exceed 40% of revenue. Smart safes and recyclers eliminate two manual counts per shift, reduce till discrepancies by an average of 62%, and often qualify the store for lower cash-in-transit insurance premiums. Loomis's SafePoint deployments, for instance, report average labor savings of 90 minutes per day across client sites.
The fourth category — in-store marketing — generates revenue uplift rather than cost savings, which makes its ROI calculation different from the others. Digital signage placed directly above cold vaults or on end-cap displays lifts impulse purchase rates by 15% to 25%, based on Mood Media's aggregated client data. The key variable is placement: a screen showing static menu content in the back corner adds nothing; a screen positioned at eye level within arm's reach of the product it promotes consistently moves units.
3. Refrigeration Equipment: The Backbone of C-Store Operations
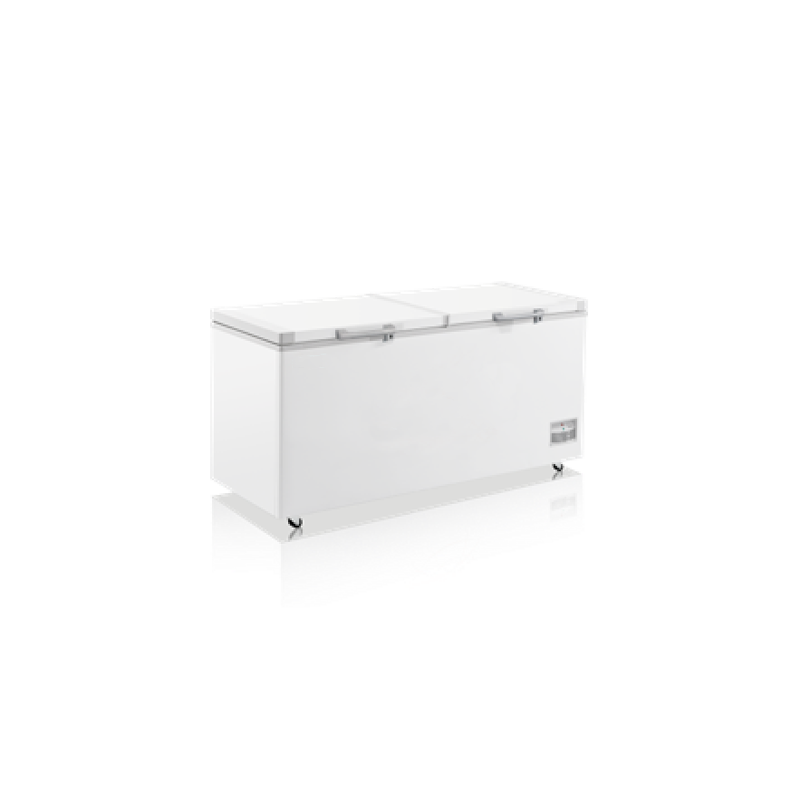
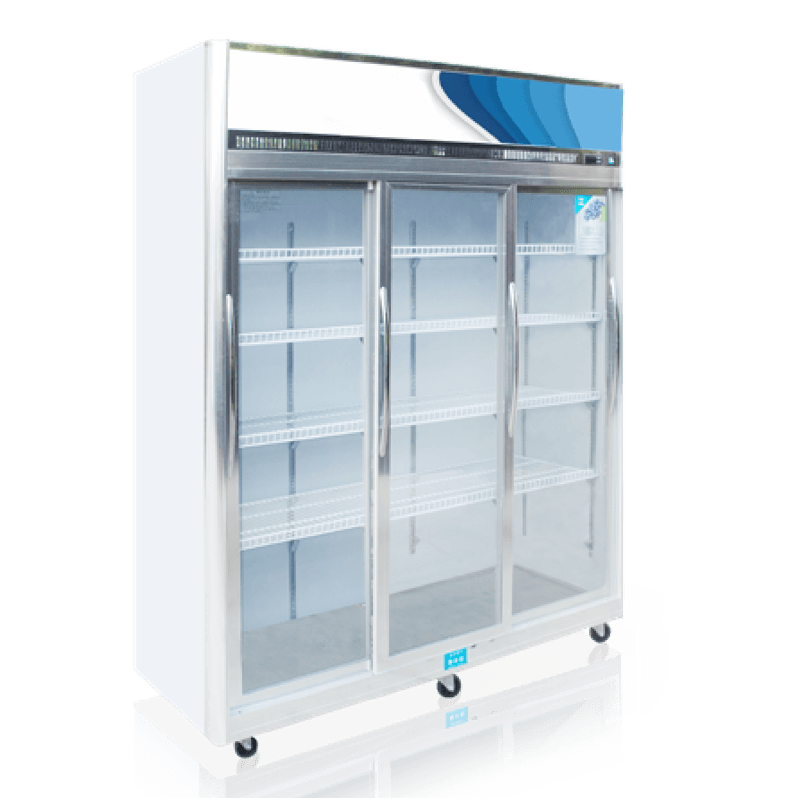
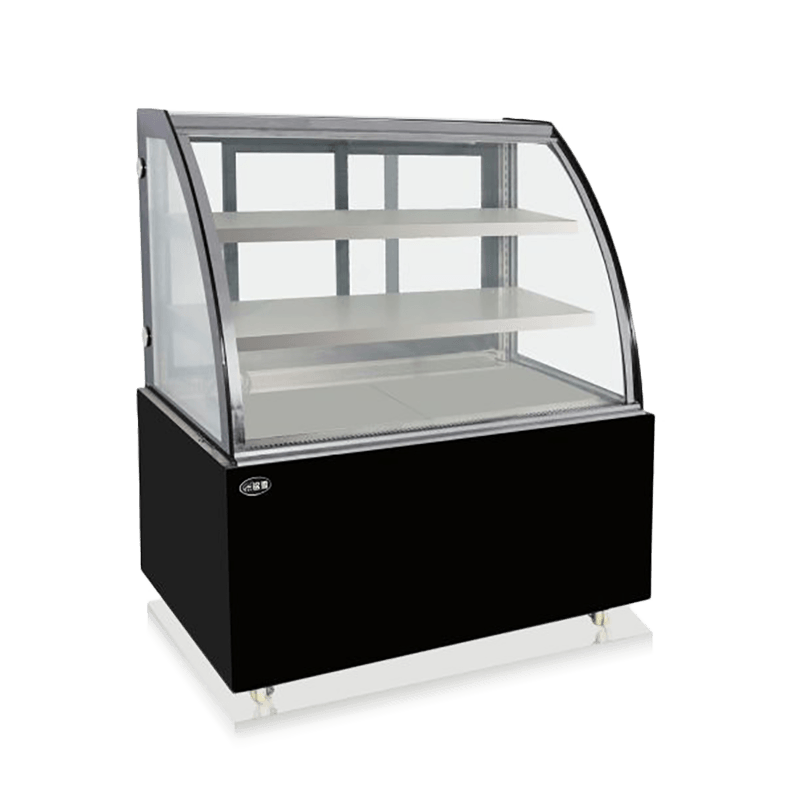
Refrigeration isn't a single purchase decision. It's a portfolio of equipment types, each optimized for different product categories, traffic patterns, and store layouts. The three primary formats — air curtain (open-front) multideck chillers, glass-door display freezers, and chest freezers — serve distinct roles, and mixing them incorrectly raises both energy bills and spoilage rates.
The table below maps each format to the metrics that matter for day-to-day operations. Notice that energy consumption and maintenance load diverge sharply between types. An open-front chiller might burn 14,000 kWh per year while a glass-door unit of equivalent capacity uses roughly 9,800 kWh — a 30% gap that compounds across a five-year equipment lifecycle.
| Metric | Air Curtain Multideck | Glass-Door Display Freezer | Chest Freezer (Solid Lid) |
|---|---|---|---|
| Annual Energy Use (kWh, 6-door equivalent) | 13,500 – 15,200 | 9,200 – 10,800 | 5,400 – 7,100 |
| Product Visibility | Excellent — no barrier | Good — through glass | Poor — requires opening lid |
| Temperature Stability (after door/lid open) | Recovers in 8–12 min | Recovers in 4–6 min | Recovers in 2–3 min |
| Best Product Fit | Beverages, dairy, grab-and-go meals | Ice cream, frozen snacks, packaged frozen foods | Bulk frozen goods, long-term storage |
| Typical Lifespan | 8–10 years | 10–12 years | 12–15 years |
| Annual Maintenance Cost | $350 – $600 | $200 – $400 | $100 – $250 |
Air curtain chillers dominate beverage and impulse-buy zones for an obvious reason: they remove every physical barrier between the customer's hand and the product. That frictionless access drives higher transaction rates, but it comes at a real energy cost. The open face bleeds cold air continuously, forcing the compressor to cycle more often. In high-humidity climates — the Gulf Coast, the Southeast — the additional moisture load pushes energy consumption toward the upper end of the range above and accelerates frost buildup on evaporator coils.
Glass-door display freezers cut energy use by roughly 30% versus open-front units of comparable capacity. The tradeoff is a small but measurable drop in impulse grabs — some studies put the reduction at 8% to 12% — because the door introduces a split-second friction point. For frozen categories where customers already know what they want (ice cream pints, family-size frozen meals), that friction barely registers in sales data. For categories where browsing drives purchases, the operator must weigh the energy savings against the impulse penalty.
Chest freezers are the workhorses of back-of-house and overflow storage. Their top-opening design traps cold air far more effectively than any vertical cabinet, which explains why a chest freezer can run on half the electricity of a glass-door unit with similar total capacity. The limitation is merchandising: buried product doesn't sell. Smart operators use chest freezers for high-velocity frozen items they can stack near the top and for backup inventory that restocks the display units during peak hours. For stores considering a chest freezer purchase, the deep-basket models with internal dividers make restocking rotation manageable without emptying the entire unit.
Climate and use pattern dictate the choice between air-cooled and direct-cool refrigeration systems. Air-cooled (fan-driven) units distribute temperature evenly across shelves and handle frequent door openings without developing hot spots. They are the correct choice for beverage vaults and any area where doors open more than 20 times per hour. Direct-cool (static plate) systems keep the evaporator embedded in shelf surfaces, which works beautifully for long-term frozen storage — ice cream, for instance, holds texture better at a steady -22°F that a direct-cool plate maintains with minimal fluctuation. The downside: recovery after a door opening takes longer, and uneven shelf loading can create warm zones.
DOE 2025 efficiency standards tightened the minimum Annual Energy Factor for commercial refrigeration equipment by roughly 15% over the previous benchmark. Any new equipment purchased today should exceed those baselines, not just meet them. Look for units using R-290 (propane) refrigerant: it carries a Global Warming Potential of 3, compared to 1,430 for R-134a, and units designed around R-290 typically draw 10% to 15% less power than equivalent R-134a models. For operators replacing pre-2018 equipment, the annual electricity savings alone typically recover the replacement cost within 14 to 20 months. The display freezer models meeting current DOE standards deliver exactly this efficiency profile.
A structured maintenance calendar prevents the slow degradation that steals efficiency month by month. Dirty condenser coils raise compressor workload by up to 15%. Worn door gaskets leak cold air continuously — a quarter-inch gap along one door edge adds roughly $100 per year to the electricity bill for that single unit. The schedule below covers the tasks that directly impact both energy consumption and equipment lifespan.
| Frequency | Task | Tools Needed | Time per Unit |
|---|---|---|---|
| Daily | Check temperature display against setpoint; wipe visible spills | Cloth, sanitizing spray | 2 min |
| Weekly | Inspect door gaskets for gaps; clean glass doors inside and out | Glass cleaner, soft cloth | 10 min |
| Monthly | Vacuum condenser coils; check drain lines for clogs | Shop vacuum, flashlight | 20 min |
| Quarterly | Verify defrost cycle operation; test door hinges and self-close mechanisms | Multimeter, screwdriver set | 30 min |
| Annually | Replace worn gaskets; calibrate thermostat; deep-clean evaporator fins | Replacement gaskets, fin comb, calibration tool | 45–60 min |
4. Technology Stack: POS, Digital Signage & Inventory Management
A c-store POS system in 2026 does far more than ring up sales. The current generation of cloud-based platforms integrates inventory management, employee scheduling, loyalty program tracking, and real-time sales analytics into a single dashboard accessible from any device. For operators still running a legacy terminal that requires manual end-of-day closeout and separate inventory spreadsheets, the labor hours lost to duplicated work easily exceed the monthly subscription cost of a modern system.
Five capabilities separate a POS that genuinely reduces operating costs from one that simply digitizes existing inefficiencies:
- Real-time inventory sync across all SKUs — The system tracks every scan and automatically flags items below reorder threshold. Manual stock counts drop from weekly to monthly or quarterly, freeing 5 to 7 staff hours per week.
- Automated purchase order generation — When inventory dips to a preset level, the system generates a draft PO for manager approval. This eliminates the cycle of running out of top-sellers between ordering windows.
- Age-verification integration — Built-in ID scanning for tobacco, alcohol, and age-restricted items reduces checkout friction and logs compliance data automatically.
- Shift-level performance reporting — Revenue, shrink, and transaction count by shift make accountability granular. Managers spot training gaps or till discrepancies within hours, not days.
- Loyalty and promotions engine — Integrated rewards programs track customer purchase history and push targeted offers. Stores using integrated loyalty see repeat visit frequency rise 18% to 25% compared to punch-card programs.
Digital signage has moved from novelty to near-necessity in c-stores where beverage and snack sales drive margin. A single 43-inch screen positioned above the cold vault, cycling through high-margin product promotions, costs roughly $900 to $1,500 including the media player. At a 15% impulse lift on targeted products — the conservative end of Mood Media's reported range — a store doing $8,000 per week in cold beverage sales sees an additional $120 per week in revenue attributable to the signage. The hardware pays for itself inside of three months.
Three layout approaches consistently outperform ad-hoc screen placement. First, position screens within the customer's natural sightline — above eye level but below the ceiling, tilted slightly downward — in the cold beverage aisle. Second, install smaller 22-inch displays at end-cap freezer units, cycling content specific to the products immediately adjacent. Third, integrate the POS customer-facing display to up-sell during checkout: "Add a chilled energy drink for $2.49?" appears while the customer waits for card processing. The checkout up-sell alone converts at 8% to 12% in high-traffic stores.
5. Cash Management & Payment Solutions
Cash still represents 28% to 35% of c-store transaction volume in most U.S. markets, and every dollar of cash that passes through a till creates labor, error, and security exposure. Traditional cash drawers require counting at shift change, manual deposit preparation, and trips to the bank — tasks that collectively consume 45 to 90 minutes of staff time per day.
Smart safe and cash recycler technology addresses this stack of inefficiencies in a single device. Employees insert bills directly into the unit, which counts, validates, and stores cash in a secured cassette. The machine dispenses change automatically during transactions, eliminating the open cash drawer and the counting errors that come with it. The table below compares the three-year total cost of a traditional cash handling workflow against a smart safe deployment.
| Cost Factor | Traditional Cash Drawer | Smart Safe System |
|---|---|---|
| Equipment Cost (3-year amortized) | $400 | $4,200 |
| Staff Labor (counting, reconciliation, bank runs) | $14,600 | $4,800 |
| Cash Shrinkage (industry avg 1.2% of cash sales) | $22,500 | $6,700 |
| Cash-in-Transit Insurance Premium | $3,200 | $2,100 |
| Three-Year Total | $40,700 | $17,800 |
The $22,900 savings over three years in this model — roughly $7,600 per year — comes primarily from labor recovery and shrinkage reduction. Smart safes cut cash shrinkage by 60% to 70% because every bill is machine-counted at the point of insertion and the cash is inaccessible to staff once deposited. The labor reduction is equally straightforward: shift-change counting drops from 15 minutes to zero, and daily bank deposits can often move to twice-weekly armored car pickups.
Contactless payment adoption has accelerated to the point where 42% of c-store transactions now use tap-to-pay cards, mobile wallets, or contactless-enabled POS terminals. Upgrading terminals to accept these methods costs $200 to $400 per checkout lane and cuts average transaction time by 6 to 8 seconds versus chip-card insertion. For a store processing 400 transactions per day, those seconds compound into roughly 40 to 53 minutes of recovered time — the equivalent of one peak-hour staff shift per week.
6. Budget-Friendly Solutions for Independent C-Stores
Single-store operators and owners of two to five locations face a different investment calculus than regional chains. There is no corporate CapEx budget, no centralized procurement department negotiating volume discounts, and no cushion of scale to absorb a purchasing mistake. Every dollar spent on equipment is a dollar that cannot go toward inventory, payroll, or lease payments. The solution is not to delay all investment — that path leads to rising energy bills, spoilage losses, and customer defection — but to sequence purchases in tiers that match available capital to the highest-impact upgrades first.
The three budget tiers below assume a typical 1,800 to 2,500 square-foot c-store with moderate traffic. Each tier builds on the previous one, so an operator who starts at Tier 1 can add Tier 2 components in year two without discarding or replacing earlier investments.
| Tier | Total Budget | Components | Expected Annual Savings / Revenue Uplift |
|---|---|---|---|
| 1 — Essentials | $5,000 – $7,000 | Cloud POS system (1 terminal), one glass-door display freezer to replace oldest open-front unit, basic contactless terminal | $2,800 – $4,100 (labor + energy + reduced shrink) |
| 2 — Efficiency | $10,000 – $15,000 | All Tier 1 items + smart safe, one additional energy-efficient freezer, basic digital signage (1 screen) | $6,200 – $9,800 |
| 3 — Full Optimization | $20,000 – $25,000 | All Tier 2 items + full refrigeration refresh (2–3 units), second POS terminal, multi-screen signage layout, automated inventory management | $11,000 – $17,500 |
Tier 1 prioritizes the two categories with the shortest payback periods: POS technology and refrigeration efficiency. A cloud POS replaces the legacy register and eliminates manual inventory tracking, while a single sliding door display freezer upgrade targets the oldest, least efficient unit on the floor. Even one freezer swap can cut the store's refrigeration energy draw by 15% to 20% if the unit being replaced predates 2018 efficiency standards.
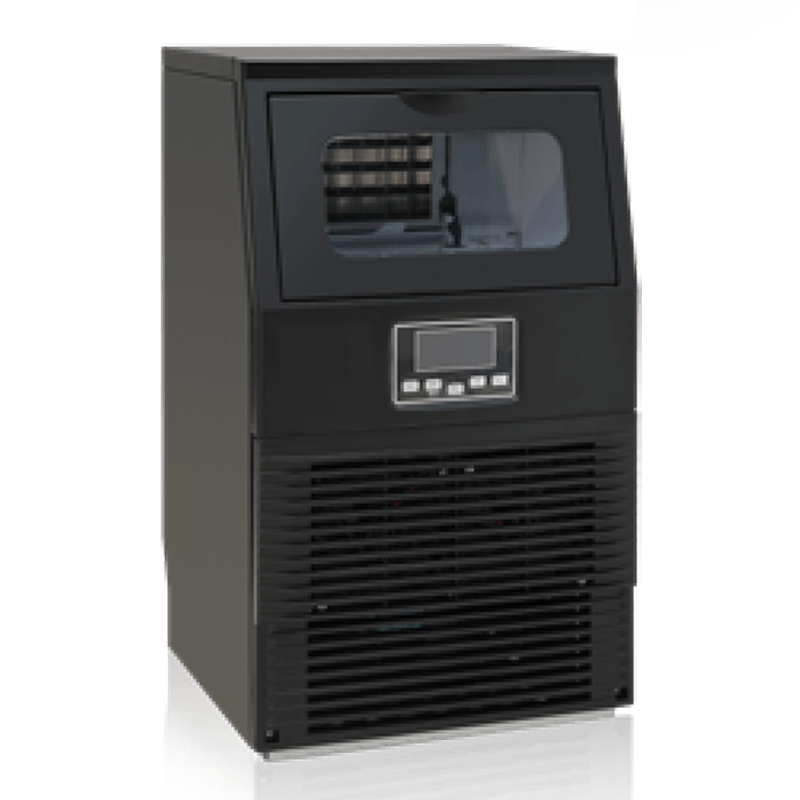
For stores where ice sales are a meaningful revenue line — common in coastal, resort-adjacent, and Sun Belt locations — an efficient ice maker belongs in the Tier 1 or early Tier 2 budget. A unit producing 200 to 300 pounds of ice per day with a storage bin of 150 pounds can serve a store selling 80 to 120 bags per day during summer peaks without running out or requiring twice-daily production cycles. The key specification to check is the Energy Efficiency Ratio (EER): look for models delivering at least 8.0 EER, which keeps the incremental electricity cost per bag of ice below $0.08.
7. Implementation Roadmap: From Assessment to Deployment
Buying the right equipment solves only half the problem. The other half is deploying it without disrupting store operations, confusing staff, or creating a period where both old and new systems run in parallel, doubling the workload. A phased approach — assess, pilot, train, then scale — keeps the store selling while the transition happens.
Phase 1: Assessment (Weeks 1–3). Audit current equipment age, energy consumption, and maintenance history. Pull 12 months of utility bills and map consumption to specific refrigeration units using plug-level monitors or — for larger stores — submetering. Document every manual process that consumes staff time: shift counts, deposit preparation, inventory checks, purchase order calls. These documented hours become the baseline against which you measure the savings from new systems. For stores considering a catering display cabinet or expanded foodservice equipment, this phase should also include a foot-traffic heat map — where do customers stop, browse, and walk past without engaging?
Phase 2: Supplier Selection (Weeks 4–6). Request quotes from at least three vendors for each equipment category. Evaluate not just purchase price but warranty terms, spare parts availability in your region, and the vendor's track record with stores of your size. A manufacturer offering a five-year compressor warranty signals different confidence than one offering 18 months. Check whether the POS provider's API integrates with your fuel pump controller, your lottery terminal, and your age-verification scanner — integration gaps create manual workarounds that erode the labor savings you are buying the system for.
Phase 3: Pilot Deployment (Weeks 7–10). Install and test the first wave of equipment in a controlled scope — one checkout lane, one freezer unit, one signage screen. Run the new system in parallel with the old for at least two full weeks. Compare transaction logs, energy readings, and staff feedback daily. Fix configuration issues before expanding. The most common failure point at this stage is inadequate Wi-Fi coverage: cloud POS and digital signage both depend on stable connectivity, and a dead spot near the cold vault can render a signage screen useless.
Phase 4: Full Rollout (Weeks 11–16). Deploy remaining equipment according to a schedule that minimizes downtime — swap out one freezer at a time, not all three on the same day. Train all staff in two sessions: a hands-on walkthrough before go-live, and a follow-up session two weeks later to address the edge cases that only emerge during real customer interactions. Track the baseline metrics established in Phase 1 against the first 90 days of full operation. Most operators see 80% of projected savings materialize within that window; the remaining 20% comes from process refinement and staff familiarity.
8. Measuring What Matters: The Metrics That Confirm Your Investment Is Working
Operators who install new equipment without defining success metrics often end up satisfied with placebo improvements — the new freezer feels colder, so it must be saving money. Feeling colder is not a metric. Three numbers tell you whether your investment is actually performing:
First, energy cost per square foot per month. Pull this from utility bills before and after a refrigeration upgrade, normalize for seasonal temperature variation, and compare year-over-year rather than month-over-month. A properly specified glass-door replacement for an open-front chiller should show a 15% to 25% reduction in the store's total electricity cost within the first full quarter. If the reduction is smaller, check condenser cleanliness, door seal integrity, and defrost cycle frequency.
Second, shrink rate by category. A cloud POS paired with smart inventory tracking should push total shrink below 0.8% of revenue within six months. If certain categories — cigarettes, energy drinks, high-value snacks — remain above 1.5%, the issue is likely theft or scanning errors, not system configuration, and requires a targeted staff audit.
Third, transaction time from scan start to receipt print. Contactless payment and modern POS interfaces should bring the average transaction below 25 seconds for a three-to-five-item basket. Track this weekly during the first two months after deployment. Slowdowns often trace to one of three causes: staff reverting to manual item entry instead of barcode scanning, network latency during card authorization, or customers unfamiliar with the contactless terminal placement. Each cause has a different fix, but you cannot apply the fix without isolating the bottleneck.


